Centers for Disease Control
Centers for Disease Control
2 minute read
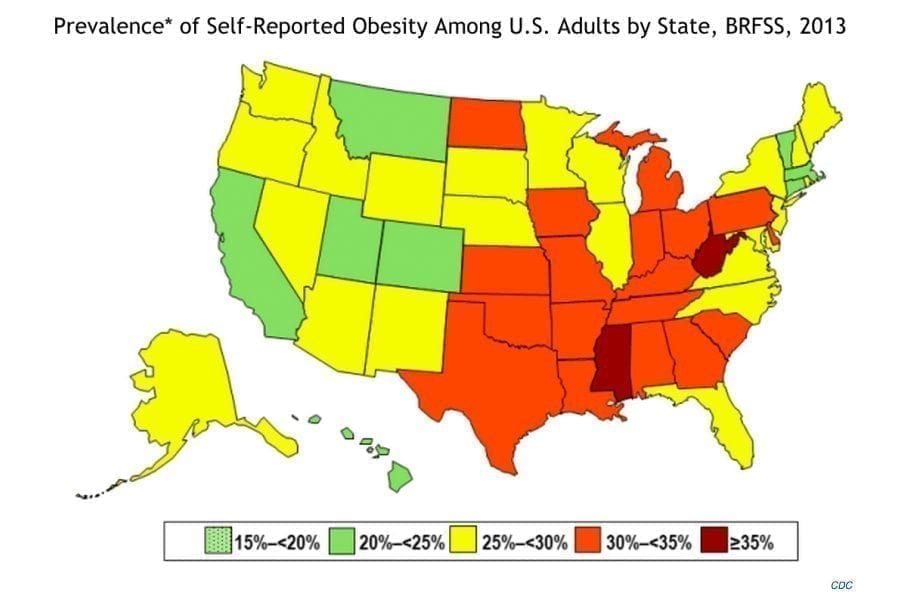
You know how it goes: A study comes out, ranking each state in terms
2 minute read
You know how it goes: A study comes out, ranking each state in terms
Recipes
Easy Prep Recipes
Nutrition per serving
-
Calories 364
-
Total Fat 6
-
Cholesterol 65
-
Carbohydrate 44
-
Dietary Fiber 7
-
Sugar 10
-
Protein 34
Nutrition per serving
-
Calories 391
-
Total Fat 16g
-
Cholesterol 65
-
Carbohydrate 57g
-
Dietary Fiber 6.5g
-
Sugar 40g
-
Protein 8.6g
Nutrition per serving
-
Calories 135
-
Total Fat 6g
-
Cholesterol 10mg
-
Carbohydrate 18g
-
Dietary Fiber 1g
-
Sugar 5g
-
Protein 3g
Nutrition per serving
-
Calories 364
-
Total Fat 6
-
Cholesterol 65
-
Carbohydrate 44
-
Dietary Fiber 7
-
Sugar 10
-
Protein 34
Nutrition per serving
-
Calories 364
-
Total Fat 6
-
Cholesterol 65
-
Carbohydrate 44
-
Dietary Fiber 7
-
Sugar 10
-
Protein 34
Nutrition per serving
-
Calories 364
-
Total Fat 6
-
Cholesterol 65
-
Carbohydrate 44
-
Dietary Fiber 7
-
Sugar 10
-
Protein 34